
Using Pin As A Coverage Diagnostic Tool for Fuzzers
F
Software developer with experience in security, graphics, and compilers.
Search for a command to run...
No comments yet. Be the first to comment.
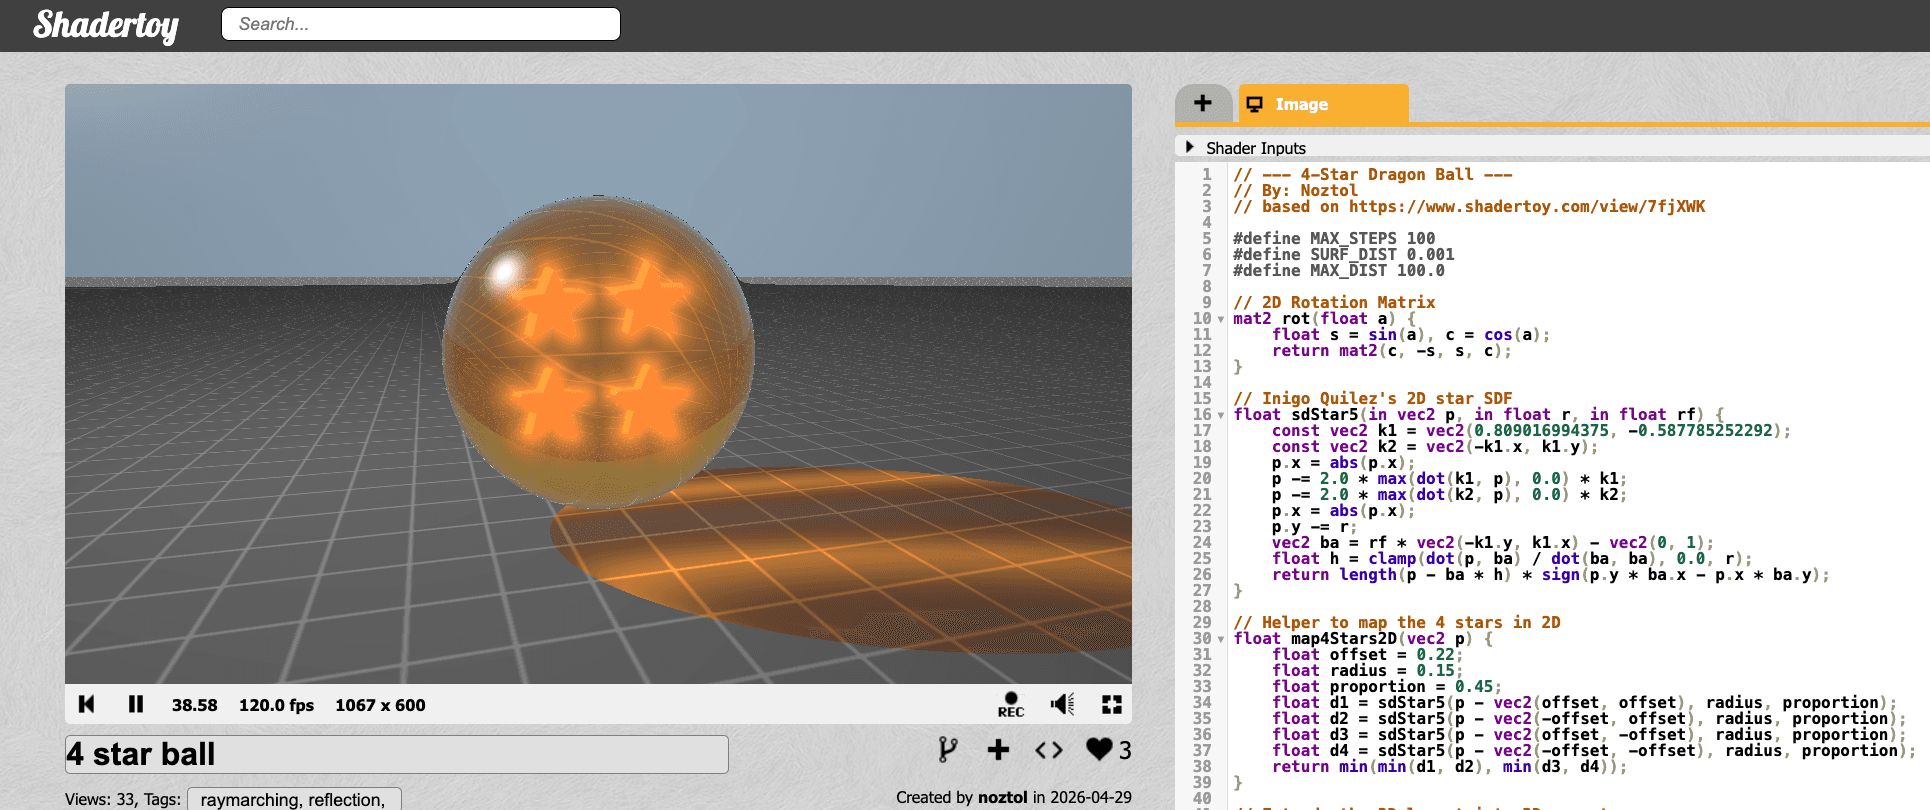
Today we are deconstructing the 4-Star Dragon Ball shader (available on Shadertoy here). This shader is a good example of using 2D math to drive 3D optical effects. To understand it, we must reference
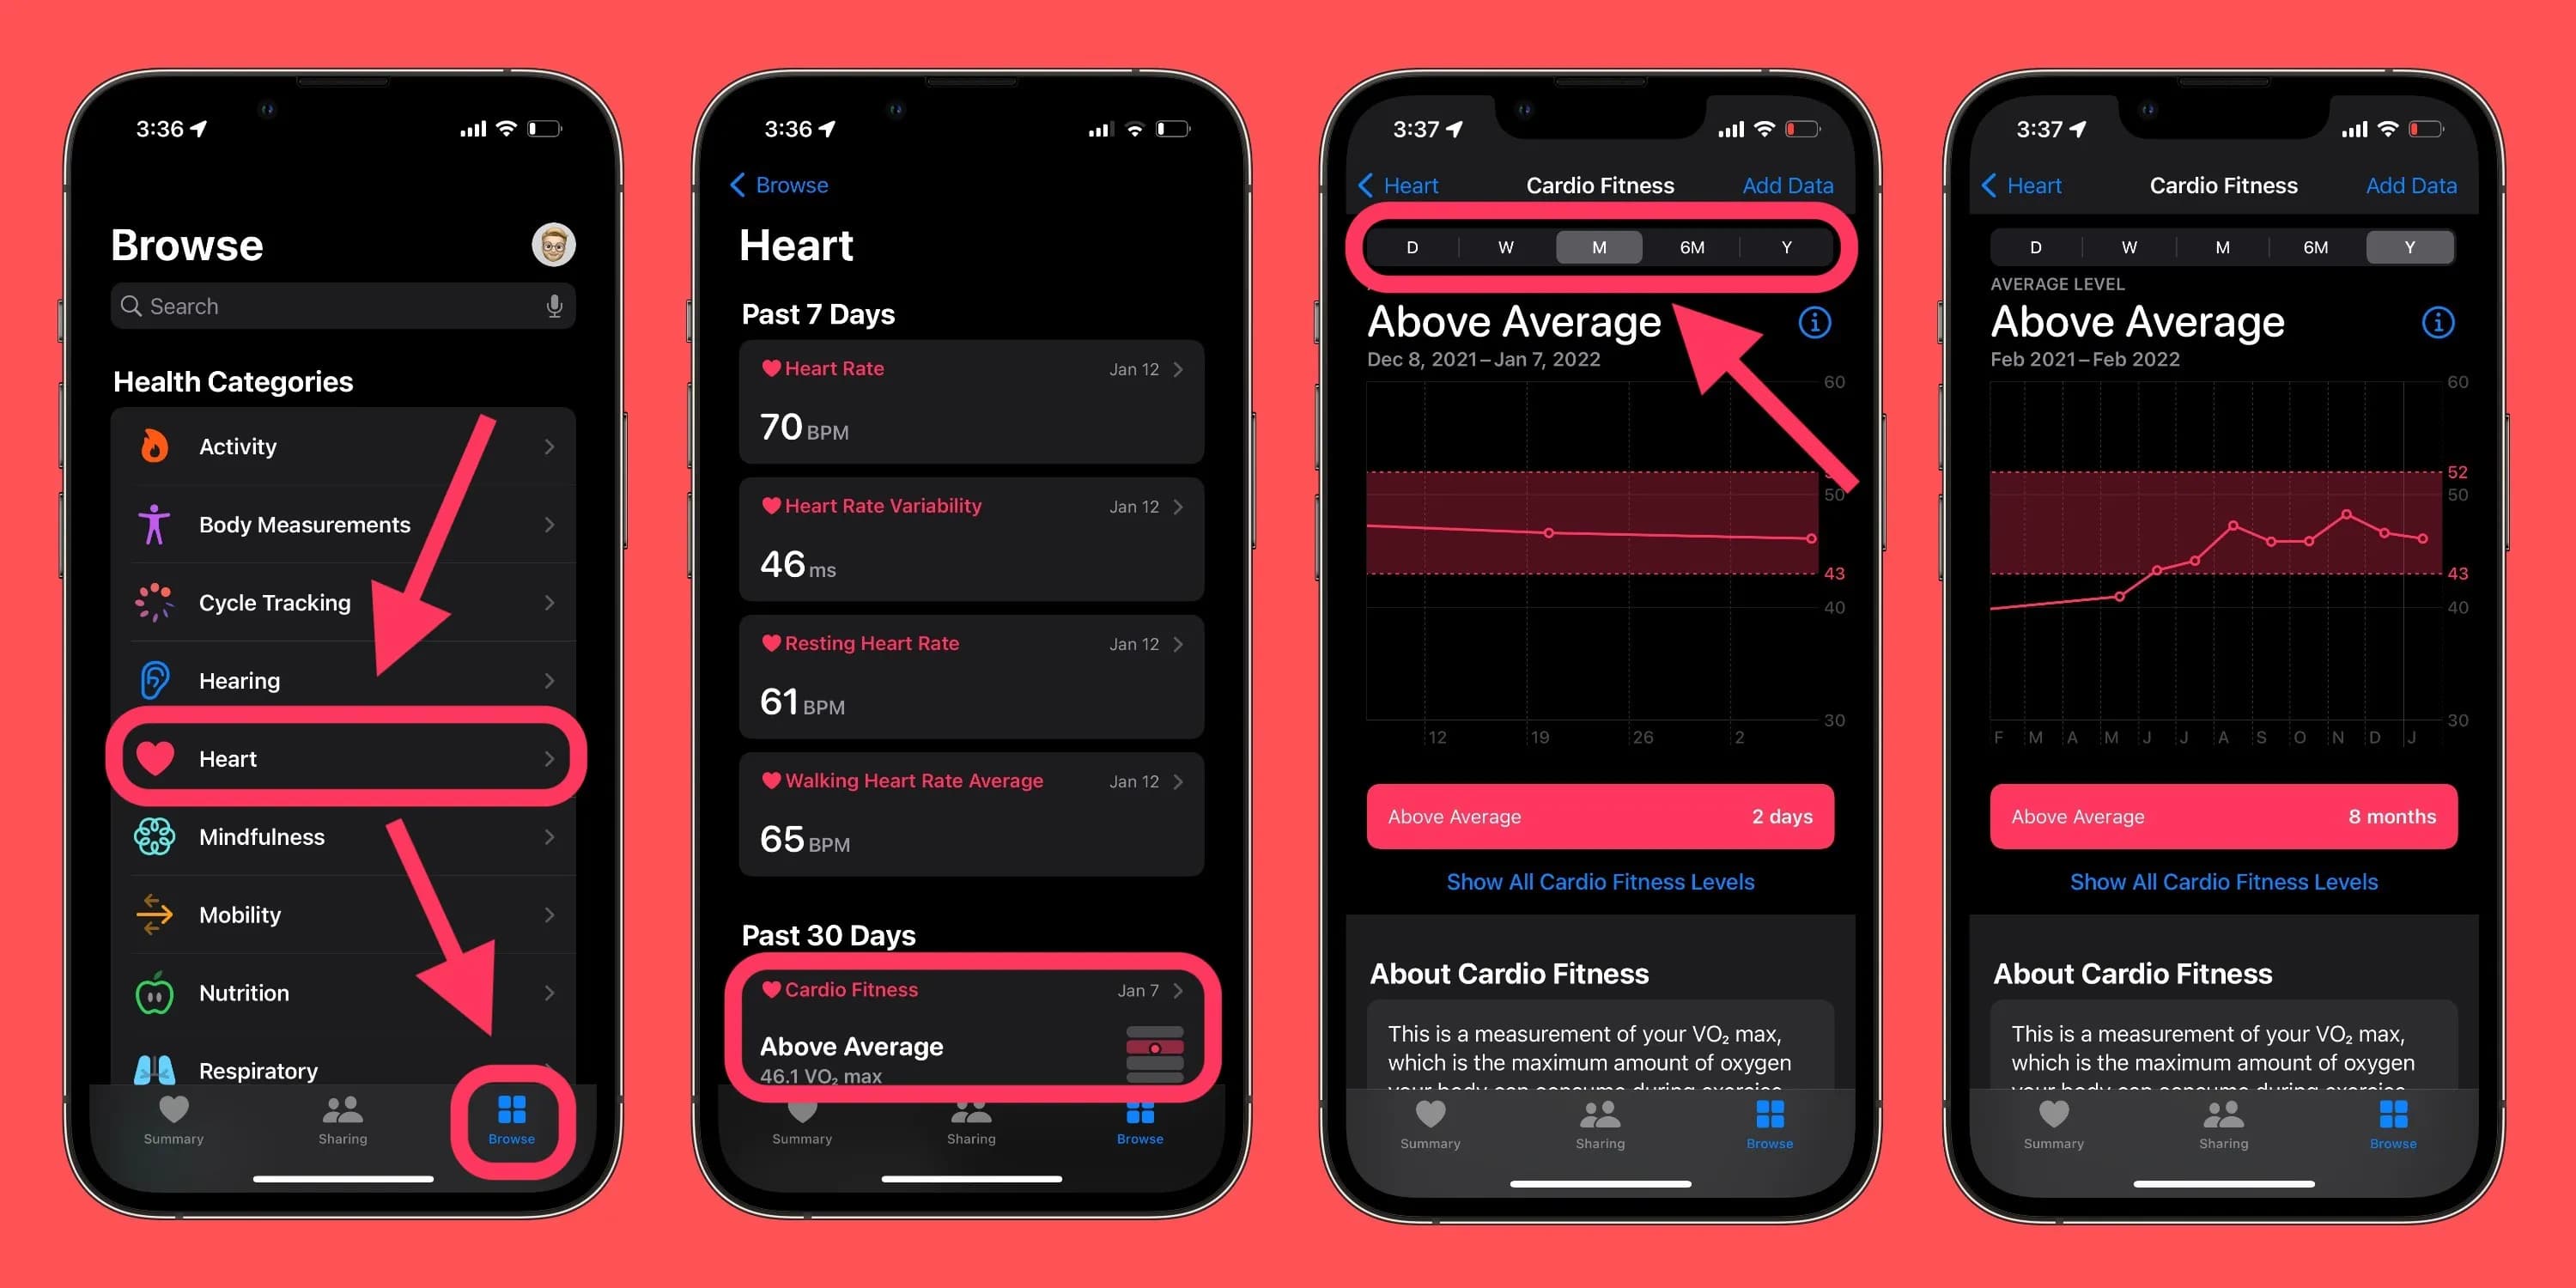
In Part 1, I talked about the high-level "magic" happening on your wrist. How Apple uses neural networks and math to guess your VO2Max even when you’re just walking around the block. But if you're lik
I am a data junkie. I track, measure, and optimize. So, when a severe ankle injury recently sidelined me, the hardest part wasn't the physical pain it was watching my hard earned fitness metrics plumm
In my previous post, I detailed how our move from the Android Emulator to standalone Android-x86 VHDX images gave us impressive cost saving wins for our fuzzing budget. With any infrastructure pivot,

When I was the head of Microsoft's Edge security for the US market, we ran into an infrastructure challenge that forced us to completely rethink how we fuzzed Android. The project we built no longer e
When working with libfuzzers, developers often hit a "coverage wall" where the fuzzer fails to reach deep code paths. While standard coverage reports show what was hit, they lack the temporal context to explain why a fuzzer is getting stuck. This tool is designed to bridge that gap by providing a detailed analysis of basic block execution using dynamic binary instrumentation.
The project leverages the Intel Pin framework to monitor fuzzer execution at the basic block level. To get started, you'll need to fetch the framework and build the tool:
./fetchpintool.sh
export PIN_ROOT=pin-3.24-98612-g6bd5931f2-gcc-linux
make
The core of the tool involves instrumenting every basic block (BBL) within a set of target functions. We use a trace-based approach to insert analysis calls before each block executes.
// From aPinTool.cpp
// Instruments basic blocks to track visits
VOID Trace(TRACE trace, VOID* v) {
    for (BBL bbl = TRACE_BblHead(trace); BBL_Valid(bbl); bbl = BBL_Next(bbl)) {
        INS head = BBL_InsHead(bbl);
        PIN_LockClient();
        RTN rtn = INS_Rtn(head);
        if (RTN_Valid(rtn)) {
            string rtnName = RTN_Name(rtn);
            if (IsFunctionWatched(rtnName)) {
                // Record the visit for temporal analysis
                BBL_InsertCall(bbl, IPOINT_BEFORE, (AFUNPTR)RecordBblVisit,
                               IARG_ADDRINT, BBL_Address(bbl),
                               IARG_ADDRINT, RTN_Address(rtn),
                               IARG_PTR, new string(rtnName),
                               IARG_END);
            }
        }
        PIN_UnlockClient();
    }
}
Because the Pintool does not automatically unmangle C++ names, you need to identify the mangled names of the functions you wish to instrument. A common workflow involves comparing demangled and mangled symbols from your fuzzer binary:
readelf -Ws textFieldFuzzer | awk '{print $8}' | c++filt > functionNamesDemangled.txt
readelf -Ws textFieldFuzzer | awk '{print $8}' > functionNamesMangled.txt
By putting these files side-by-side, you can find the human-readable function name in the demangled file, jump to the corresponding line in the mangled file, and copy that string into your function_filter.csv.
To manage the high volume of data generated during fuzzing, the tool supports function filtering via a CSV file. This allows you to focus the diagnostic overhead only on the modules or functions you are currently debugging. Note that function names must be provided in their mangled form (e.g., _Z11FieldFuzzer...).
// Logic to filter instrumentation by function name
bool IsFunctionWatched(string name) {
    if (watchedFunctions.empty()) return true;
    return watchedFunctions.find(name) != watchedFunctions.end();
}
Once your filter is set, you can run the fuzzer through the Pintool to generate a .dot file, which can then be converted into a visual graph.
mkdir dotFiles
pin-3.24-98612-g6bd5931f2-gcc-linux/pin -t obj-intel64/aPinTool.so -od dotFiles/cfg.dot -i function_filter.csv -- ./textFieldFuzzer -max_total_time=1
dot -Tpng dotFiles/LLVMFuzzerTestOneInput_cfg.dot -o LLVMFuzzerTestOneInput.png
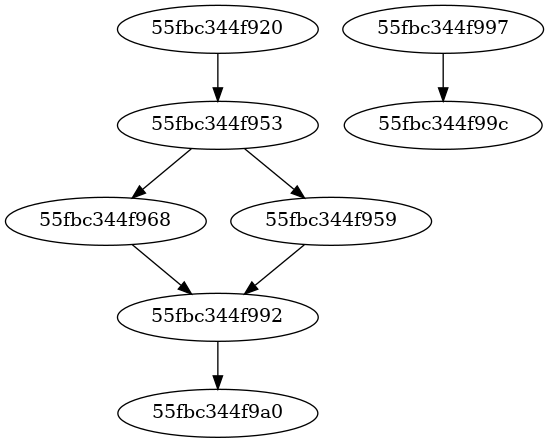
Example CFG generated for LLVMFuzzerTestOneInput
The tool generates a bblockReport.txt file which tracks two primary metrics:
Seen Order: The order basic blocks were first discovered, segmented by routine (function).
Last Visited Order: A sorted list of basic blocks based on the last time they were reached. This is the "high-water mark" that tells you exactly where the fuzzer stopped making progress.
As this is a specialized diagnostic tool, there are several key implementation details to keep in mind:
Debug Builds Only: The tool requires DWARF symbols to perform function name lookups for filtering.
System Constraints: Certain C++17 features like std::filesystem do not currently run within the Pintool environment. Manual directory creation is required.
Timing APIs: Due to language-specific API limitations in Pin, the tool uses gettimeofday for high-precision timing.
Executable Scope: By default, instrumentation is limited to the main executable. To include shared libraries, the image filter logic must be adjusted:
// Change this:
if(!IMG_IsMainExecutable(insImage)) { return; }

// To this:
if(!IMG_IsMainExecutable(insImage) || !getTelemetry().isInSharedLibraryFilterList(insImage)) { return; }
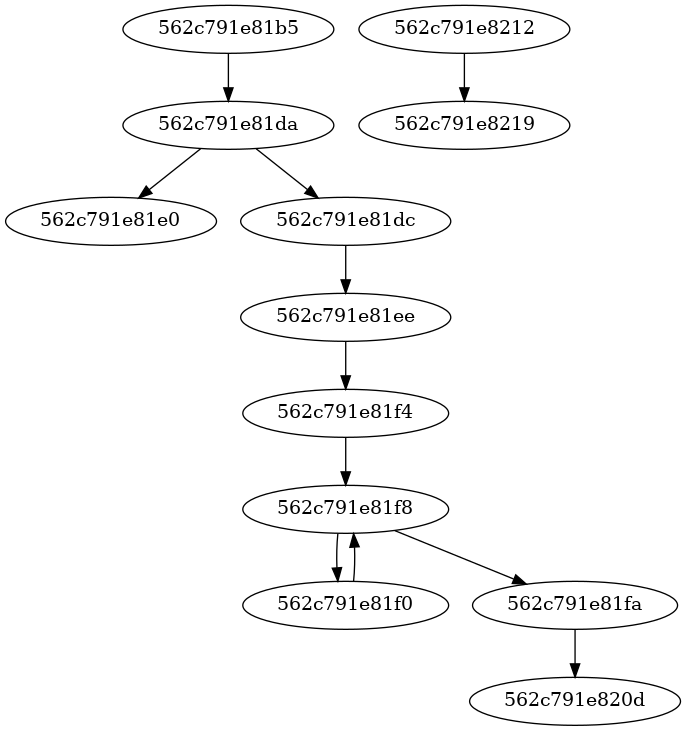
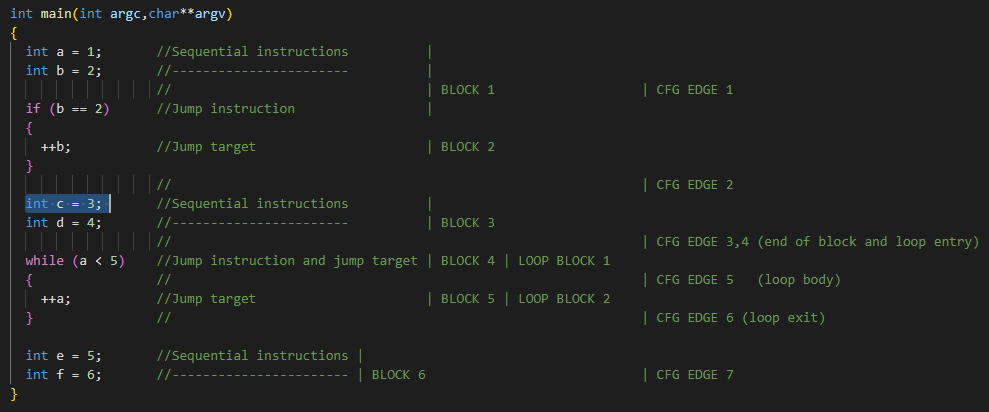
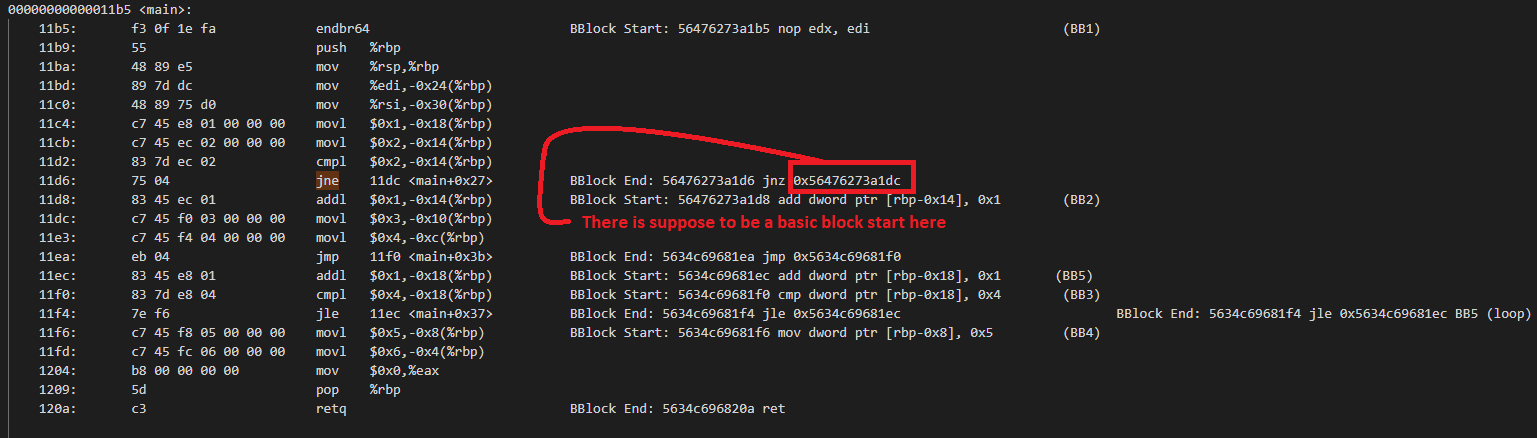
Pintool creates basic blocks based on dynamic execution. In some cases, C++ code that looks like it should have 6 blocks might only show 5 in practice because certain branches (like a specific if condition) are never "taken" at the assembly level, resulting in the fuzzer flowing through them as a single execution block.
Check out the full source code and experiment details on GitHub:
https://github.com/farzonl/coverage-experiment
First published at blog.farzon.org on April 5th